Troubleshooting Slow Drain Devices on Broadcom Switches

Slow drain devices are one of the more common problems on storage networks. They can occur for a variety of reasons. For a refresher on how they can affect your storage network you should watch this video. In this blog post I will go through the basic steps to troubleshoot a slow drain device on a Broadcom fabric. I will be using command line output from switches. The CLI format lends itself better to a blog post more readily than screen shots from a GUI, and the commands are consistent across different versions of FOS. SANnav is a huge change from Brocade or IBM Network Advisor and the screens would look quite different between the two.
The first command we will be using is porterrshow.

The above output has been truncated for the ports we are interested in. The counters of interest are in the c3timeout column. You can see that there are 2 sub-columns, 'tx and 'rx'. 'tx' means the switch is trying to send frames to the device attached to that port, but frames are timing out and being discarded. 'rx' means the switch received frames on that port but cannot forward them. The crc, crc_g_eof and pcs_err counters are all 0. This means these links are not faulty. Faulty links can cause slow drain conditions.
Port 135 is the slow drain port. The 'tx' column under c3timeout is non-zero. Frames are always discarded in the direction of the 'tx' counter. For the above example, the device attached to port index 155 (with 'rx' non-zero) is trying to send frames to the device attached to port index 135 (with 'tx' non-zero).
NOTE: You can see the 'disc c3' column also has non-zero values. Frames can be discarded for reasons other than timeout. This column is a total of all discards, including slow drain. For troubleshooting slow drain, you need to look at the 'c3timeout' columns. If the 'disc c3' column is non-zero, but the tx and rx columns are zero, then frames are not timing out and there is no slow drain device. In that case you would need to use the 'portstatsshow' command to view why those discards are happening.
If the 'tx' column is non-zero for a port that is an inter-switch link (ISL) to another switch, that means the switch you are looking at is having problems sending frames to another switch and the slow drain device is attached to that switch (or the ISL itself is oversubscribed but this is rare). You would need to then look at the remote switch to find ports with the tx timeout value.
The next thing we need to do is try to figure out what is attached to these two ports. For that, we can use the 'switchshow' command. The output has again been truncated for brevity. You can see a device attached to port 135 and likely an IBM DS8000 attached to port 155. You can tell this by the first 4 bytes of the WWPN. 50:05:07:63: is generally DS8000, but can be an IBM Tape device. 50:05:07:68 is IBM Spectrum Virtualize.

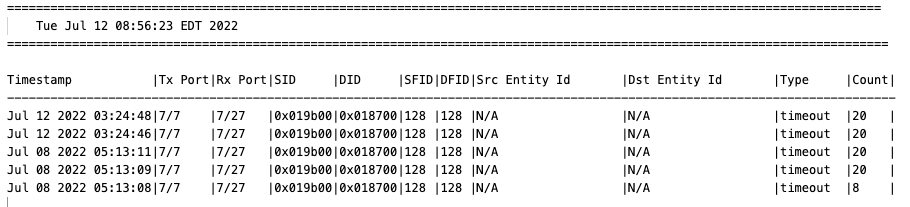
From the framelog we can see that the discards in the porterrshow are recent - since they are timestamped recently in the framelog. If the discards were not recent, or none were listed, the counters from the porterrshow are likely old and would have to be cleared and the switch monitored.
Additionally if either the SID or DID NPortIDs were attached to a different switch we could use the nsshow command to identify which switch the device was on so we would know which remote switch to look at.
You can also use monitoring tools such as IBM Spectrum Control or IBM Storage Insights to monitor your storage and fabrics. These tools can alert you for many of the problems that can cause slow drain conditions to occur. Check out this link for information on IBM Storage Insights.


Comments
Post a Comment